Design against fatigue failure
As was discussed previously, cyclic loading is more likely to lead to fatigue failure. Under fatigue, structures fail much sooner than their respective material properties; i.e. materials can fail when stress is below yield. It is important to understand how and why fatigue can cause components to fail well below their material properties.
Fatigue faliure occurs from cracks and their effect on stress present in the structure. In order for fatigue failure to occur, it requires three steps:
- Crack initiation
- Propagation
- Final failure
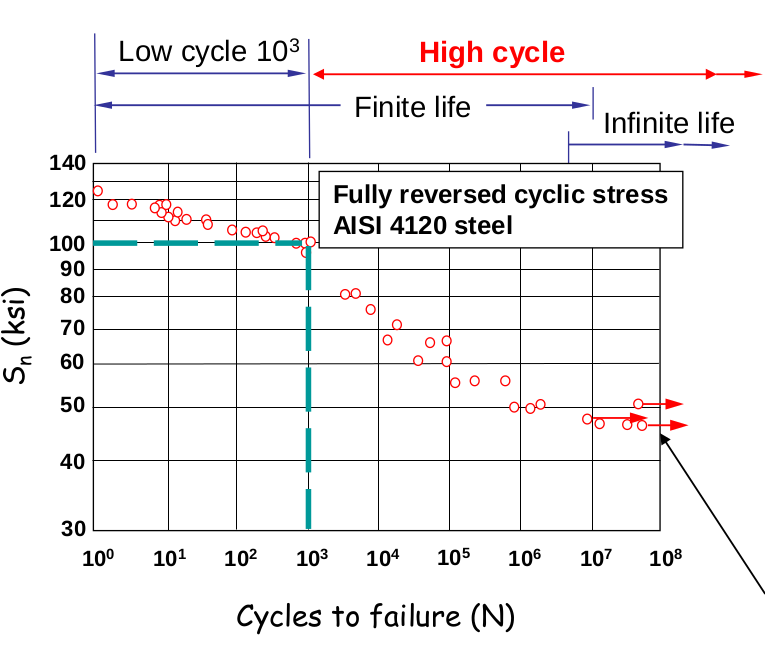
Understading the behaviour of the crack, is ultimately what can lead to a poor or adequate design. Fracture mechanics is all concerned with understading the behaviour at the crack tip and how the plastic zone around the crack propagates, however that content is beyond this post. From a generalistic/top down view, fatigue failure of components can be determined through S-N curves. These curves have been developed as a result of Moore’s Test on ‘Measurement of Fatigue Life’. Typical S-N curve is seen below.

From S-N curves we can define the following concepts:
- Fatigue strength: stress at which material endures N cycles, cycles typically used.
- Endurance limit: stress which gives inifinite life for material (typically for steels). Endurace limit is observed where fatigue strength doesn’t change with increasing N cycles. Materials where there is no apparent plateau fatigue strength at is typically chosen
While S-N curves provide a good estimation for an ideal component, in practice results don’t stack up. Due to that reason, there are a number of factors which need to be added to give a better number for fatigue strength & endurance limit. Factors applied which are to be applied, can be retrieved from engineering standard.
With data from S-N curve and practical factors applied, a conservative estimation can be fitted to allow prediction of the fatigue life. This equation is known as the power law, defined as:
where = fatigue strength, N = cycles, m & b = determined from material S-N curve.
With a constant, fluctuating stress, fatigure life can be determined (conservative estimate) by the following steps:
- Detemine cyclic stress; number of cycles
- From S-N curve and engineering standards, determine fatigue strength and endurance limit. Ensure practical factors are applied
- Use power law to determine m & b
- Use power law to determine cycles at the desired stress level
Power law works really well once stress level is consitent throughout the life of the component. However if the cycle changes at any point in time (different amplititude, but not mean stress), this principle cannot be applied on its own. The solution: cummulative damage calculation. Determining fatigue damage done at each individual stress cycle, allowing to predict failure for all stress cycles. This theory is called Miner’s rule and is defined as follows:
(at failure)
where = number of cycles at stress level; = number of cycles at stress level calculated from Power rule
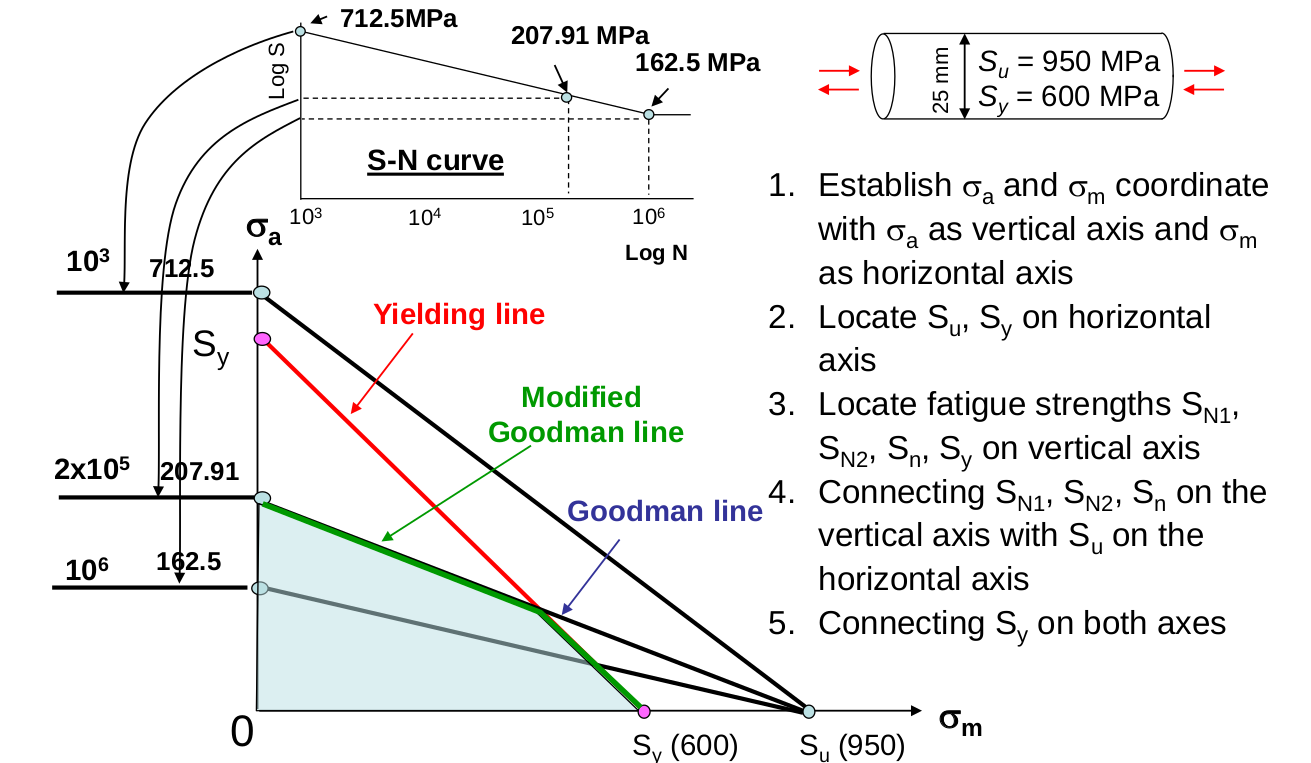
As mentioned, power low assumes mean stress is zero; amplitude is mirrored about the horizontal axis. In certain applications, stress does not vary equally in both directions, therefore a different approach is required. S-N curves are still used to determine fatigue data about the component, however instead of using Miner’s rule directly, constant-life fatigue diagram needs to be established. This approached can take various forms, which are all dependent what failure is defined for the application. Constant life diagrams can be establied using the following criteria:
- Goodman line: straight line from material fatigue strenth to material ultimate strength
- Modified Goodman line: line from material fatigue strength to material yield strength, taking in acount yeild onset
- Gerber line: parabolic equation from fatigue strength to material ultimate strength
- Soderberg line: straight line from material fatigue strenth to material yield strength
A typical constant-life diagram can be seen below

That concludes design against cyclic failure. We have talked about 3 approaches. Power law, Miner’s rule and Constant-life diagrams. All have their place in design and are especially important in design for fatigue failure.
